HANDS-ON GUIDE
Claude in Excel: How to Turn Any Spreadsheet Into an AI-Powered Analyst
Forget VLOOKUP formulas. Anthropic’s official Excel add-in reads your entire workbook, connects data across sheets, builds charts, and writes executive summaries — all from plain English commands.
|
14 min read
|
Install guide + 10 copy-paste prompts + workflow framework
TL;DR
Claude in Excel is an official Anthropic add-in that puts a Claude sidebar directly inside Microsoft Excel. Unlike basic AI formula helpers, it reads your entire multi-tab workbook, understands how your data relates across sheets, creates pivot tables and charts, writes formulas, and generates executive-ready reports — all from natural language. It’s included free with your existing Claude Pro, Max, Team, or Enterprise subscription. No additional cost. And as of March 2026, it can share context with PowerPoint and connect to external data sources like S&P Global and FactSet.
What’s in This Guide
1. Why This Is Different From Copilot and ChatGPT
2. What You Need (Requirements & Pricing)
3. How to Install (2 Minutes)
4. What Claude Can Actually Do Inside Excel
5. The 4-Step Analysis Framework (With Prompts)
6. Cross-App Context: Excel → PowerPoint in One Thread
7. Skills: Save Any Workflow as a One-Click Action
8. MCP Connectors: Pull Live External Data
9. Limitations and Honest Caveats
10. 10 Copy-Paste Prompts to Try Right Now
1. Why This Is Different From Copilot and ChatGPT
There are now several AI tools that work with spreadsheets. Here’s why Claude in Excel is worth paying attention to — and where each option actually excels.
| Claude in Excel | Microsoft Copilot | ChatGPT (upload) | |
|---|---|---|---|
| Multi-sheet awareness | Reads entire workbook, cross-references automatically | Improving, but often limited to active sheet | Requires manual upload; no live connection |
| Chart/pivot creation | Creates directly inside Excel | Creates inside Excel | Generates images, not editable charts |
| Change tracking | Shows every change with cell-level citations | Limited tracking | N/A (works on a copy) |
| Cross-app context | Shares context with PowerPoint | Works across M365 apps | No |
| External data connectors | S&P, FactSet, Moody’s, LSEG via MCP | Limited to M365 ecosystem | No |
| Additional cost | Included with Claude Pro ($20/mo) | Requires M365 Copilot ($30/user/mo) | Requires ChatGPT Plus ($20/mo) |
The standout feature: multi-sheet intelligence. When your data is spread across multiple tabs — sales figures in one sheet, product catalog in another, customer info in a third — Claude automatically understands the relationships and cross-references them without being told. Ask “what’s my total revenue?” and it will pull quantities from the sales sheet, multiply by prices from the product sheet, and give you the answer. That’s something most users can’t do themselves without VLOOKUP expertise.
2. What You Need
✓ Microsoft Excel — Desktop (Mac or Windows) or Excel for the web. Both work.
✓ A paid Claude plan — Pro ($20/mo), Max ($100–200/mo), Team ($30/user/mo), or Enterprise. The add-in doesn’t cost extra.
✓ That’s it. No separate Microsoft Copilot license needed. No API keys. No configuration files.
If you’re already paying $20/month for Claude Pro, you get this for free. For comparison, Microsoft Copilot for Excel requires a $30/user/month Copilot license on top of your Microsoft 365 subscription.
3. How to Install (2 Minutes)
Step 1 Open Excel. Go to Home tab → Add-ins (on Mac: Tools → Add-ins).
Step 2 Click “More Add-ins” or “Get Add-ins” to open the store.
Step 3 Search for “Claude by Anthropic for Excel” → Click Add.
Step 4 A Claude sidebar panel appears on the right. Sign in with your Claude account.
Done Start typing natural language commands in the sidebar. That’s it.
Quick access tip
Once installed, press Ctrl + Option + C (Mac) or Ctrl + Alt + C (Windows) to quickly open the Claude sidebar anytime. No need to navigate through menus.
4. What Claude Can Actually Do Inside Excel
The sidebar isn’t a glorified chatbot. It’s a working AI analyst that can read and write to your spreadsheet directly. Here’s what it handles natively:
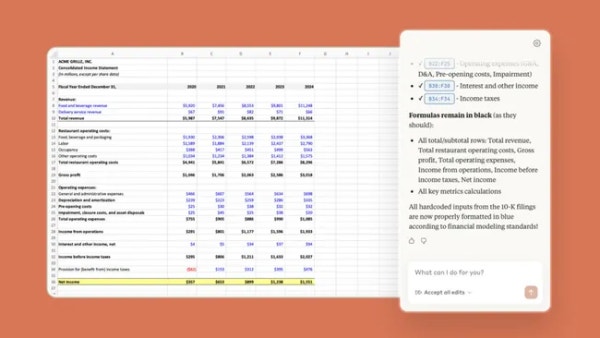
Read & understand — Scans your entire workbook structure, identifies relationships between sheets, reads cell values, and understands formula dependencies.
Write formulas — Generates and inserts formulas (VLOOKUP, SUMIF, INDEX/MATCH, etc.) directly into cells. You describe what you need in plain English; it writes the formula.
Create pivot tables — Builds, sorts, filters, and modifies pivot tables from natural language. No manual drag-and-drop configuration needed.
Generate charts — Creates bar charts, pie charts, line graphs, and trend lines directly in your workbook.
Create new sheets — Generates entire new tabs with organized data, summaries, or reports.
Analyze & explain — Interprets your data, identifies trends, spots anomalies, and explains findings in plain language.
Debug errors — Finds broken formulas, circular references, and data inconsistencies, then fixes them.
Track changes — Every modification Claude makes comes with a clear explanation and cell-level citation. You always know exactly what changed and why.
5. The 4-Step Analysis Framework (With Prompts)
Here’s a practical framework that turns Claude in Excel from “cool toy” to “serious business tool.” It follows the classic data analysis pipeline — Explore, Diagnose, Predict, Prescribe — with specific prompts for each stage.
Explore — “What do I have?”
Get Claude to survey your data, calculate totals, and surface the big picture before you dive into details.
Claude will cross-reference sheets automatically, create the pivot table and chart, and place them exactly where you want.
Diagnose — “Why is this happening?”
Dig deeper into specific patterns. This is where Claude’s multi-sheet awareness really shines — it can cross-reference sales data with customer demographics, regional info, or any other dataset in your workbook.
Claude pulls customer data from a separate tab, runs the demographic breakdown, and generates visual charts — all without you writing a single formula.
Predict — “What’s coming next?”
Use historical data to project trends and forecast future performance.
Claude generates a trend analysis sheet with projections, a visual chart with the trend line, and plain-English commentary explaining the drivers.
Prescribe — “What should we do?”
Turn your analysis into an executive-ready deliverable with recommendations and action items.
Claude produces a polished summary sheet with KPIs, analysis highlights, risk flags, and an action item table — ready to present without further editing.
Why this framework matters
Most people stop at Step 1 — they use AI to calculate totals and build a chart, then do the rest manually. But Claude’s real value shows up in Steps 3 and 4: generating insights, making predictions, and producing board-ready deliverables. That’s the gap between using AI as a calculator and using it as an analyst.
6. Cross-App Context: Excel → PowerPoint in One Thread
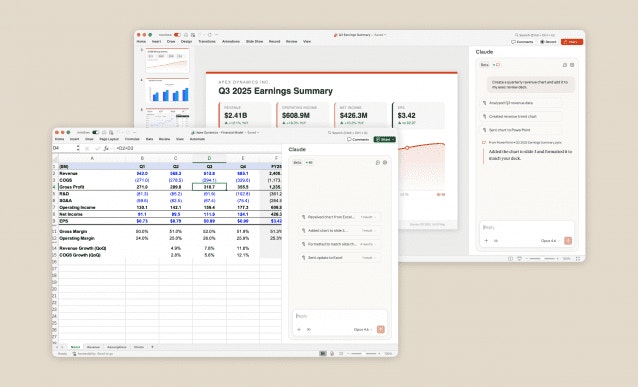
As of March 2026, Claude for Excel and Claude for PowerPoint share a single conversation thread. This means you can build a financial model in Excel, then tell Claude to create a presentation from that analysis — without re-explaining anything.
A real-world example: a financial analyst pulls comparable company data into an Excel workbook, builds a trading comps table, then tells Claude to create a pitch deck in PowerPoint using the valuation summary from the spreadsheet. Claude remembers everything from the Excel conversation and applies it to the slides automatically.
This eliminates one of the biggest time sinks in office work: the copy-paste-reformat cycle between spreadsheets and presentations. What used to take an hour of manual work — extracting key numbers from Excel, pasting them into slides, formatting tables, adding context — now happens in a single command.
How to activate this
Just install both add-ins (Claude for Excel and Claude for PowerPoint) and sign in with the same Claude account. The shared context works automatically — open both apps and Claude maintains one continuous conversation across them.
7. Skills: Save Any Workflow as a One-Click Action
This is the feature that turns Claude in Excel from a personal tool into a team-wide productivity system.
Skills let you save any workflow you’ve built with Claude as a repeatable one-click action that anyone on your team can use. Once someone figures out the right way to run a variance analysis, audit a financial model, or compile a weekly report, they can package the entire process as a Skill — and everyone else gets access to it instantly.
Pre-built Starter Skills (shipping now)
Model Auditor — Scans a workbook for formula errors, circular references, and balance-sheet integrity issues.
DCF Template — Builds a discounted cash flow model with free cash flow projections, WACC calculations, and scenario toggles.
Comparable Company Analysis — Pulls valuation multiples and operating metrics into a structured comp table.
Due Diligence Pack — Processes uploaded documents into organized spreadsheets with financial info, customer lists, and contract terms.
You can also create your own custom Skills. Any workflow you develop through conversation with Claude can be saved and shared through the add-in sidebar. Think of it as macro recording, but powered by AI instead of VBA.
8. MCP Connectors: Pull Live External Data
Claude in Excel now supports MCP (Model Context Protocol) connectors, which let Claude pull data from outside your spreadsheet without leaving Excel. This is a game-changer for anyone who works with external data sources.
Currently available connectors include S&P Global Capital IQ, LSEG (Refinitiv), FactSet, Moody’s, PitchBook, Daloopa, and Aiera. If you’ve already enabled connectors in your Claude settings, those same connections work in Excel automatically.
What this means in practice: you can ask Claude to “pull the latest quarterly revenue for Apple, Microsoft, and Google from FactSet and add it to my comparison sheet” — and it does it inside Excel, with live data, in seconds.
Who this is for
MCP connectors are especially valuable for financial analysts, investment bankers, and equity researchers who spend hours pulling data from terminals into spreadsheets manually. If your firm has access to these platforms, the time savings are substantial.
9. Limitations and Honest Caveats
Claude in Excel is impressive, but it’s still a research preview. Some things to be aware of:
⚠️ It uses your Claude usage credits. Complex multi-step analyses consume more credits than simple chat. If you’re on a Pro plan, be mindful of your daily limits. Batch related questions together instead of asking one at a time.
⚠️ It can make math mistakes. Like all LLMs, Claude is probability-based. It’s remarkably good at formulas, but always verify critical financial calculations before presenting them. Use it as a first draft, not a final answer.
⚠️ Long sessions can degrade. Claude uses automatic compression for long sessions, which can occasionally lead to context loss on very complex workbooks. If responses start getting confused, start a fresh conversation.
⚠️ Large workbooks have limits. Extremely large spreadsheets (hundreds of thousands of rows) may exceed Claude’s context window. For massive datasets, consider narrowing your query to specific sheets or ranges.
10. 10 Copy-Paste Prompts to Try Right Now
Open any Excel workbook, paste these into the Claude sidebar, and see what happens. Replace the bracketed items with your actual data.
1. “Scan this entire workbook and give me a summary of what data is in each sheet, how many rows, and how they relate to each other.”
2. “Calculate total revenue. Quantities are in the [Sales] sheet and prices are in the [Products] sheet. Show your work.”
3. “Create a pivot table on a new sheet showing [metric] broken down by [dimension]. Sort by highest to lowest.”
4. “Find all cells with errors in this workbook. List each one, explain the error, and fix it.”
5. “Create a bar chart comparing monthly revenue for [Product A] vs [Product B] over the last 6 months.”
6. “Write a VLOOKUP formula that matches [this column] with data from the [Other Sheet] and returns [the value I need].”
7. “Analyze the trend in [metric] over the past 12 months. Is it growing or declining? At what rate? Forecast the next 3 months.”
8. “Build a dashboard sheet with these KPIs: total revenue, growth rate, top 3 products, and worst-performing region. Include small charts.”
9. “Create a one-page executive summary of this workbook’s data on a new sheet. Include key metrics, trends, risks, and 3 recommended actions.”
10. “I need to present this data to my team. What are the 3 most interesting insights in this workbook? Create charts for each one.”
The Bottom Line
Claude in Excel isn’t a formula assistant. It’s an AI data analyst that sits inside your spreadsheet, reads your entire workbook, and produces the kind of output that used to require either advanced Excel skills or a dedicated analyst on your team.
The shift it represents is subtle but important: instead of learning how to tell Excel what to do (formulas, pivot table settings, chart configurations), you just tell Claude what you want to know. “Why are sales declining?” “Who’s buying this product?” “What should we tell the CEO?” — and Claude figures out how to answer using your data.
If you’re already paying for Claude Pro, install the add-in today. It takes two minutes, costs nothing extra, and the first time it cross-references three sheets to answer a question you couldn’t have answered yourself without 30 minutes of VLOOKUP work — you’ll understand why this matters.
Resources
Install the add-in → Microsoft AppSource
Official help docs → support.claude.com
Product page → claude.com/claude-in-excel
Claude plans & pricing → claude.com/pricing
⭐ Claude Just Killed the $600 AI Mac Mini Trend (For $20/mo)